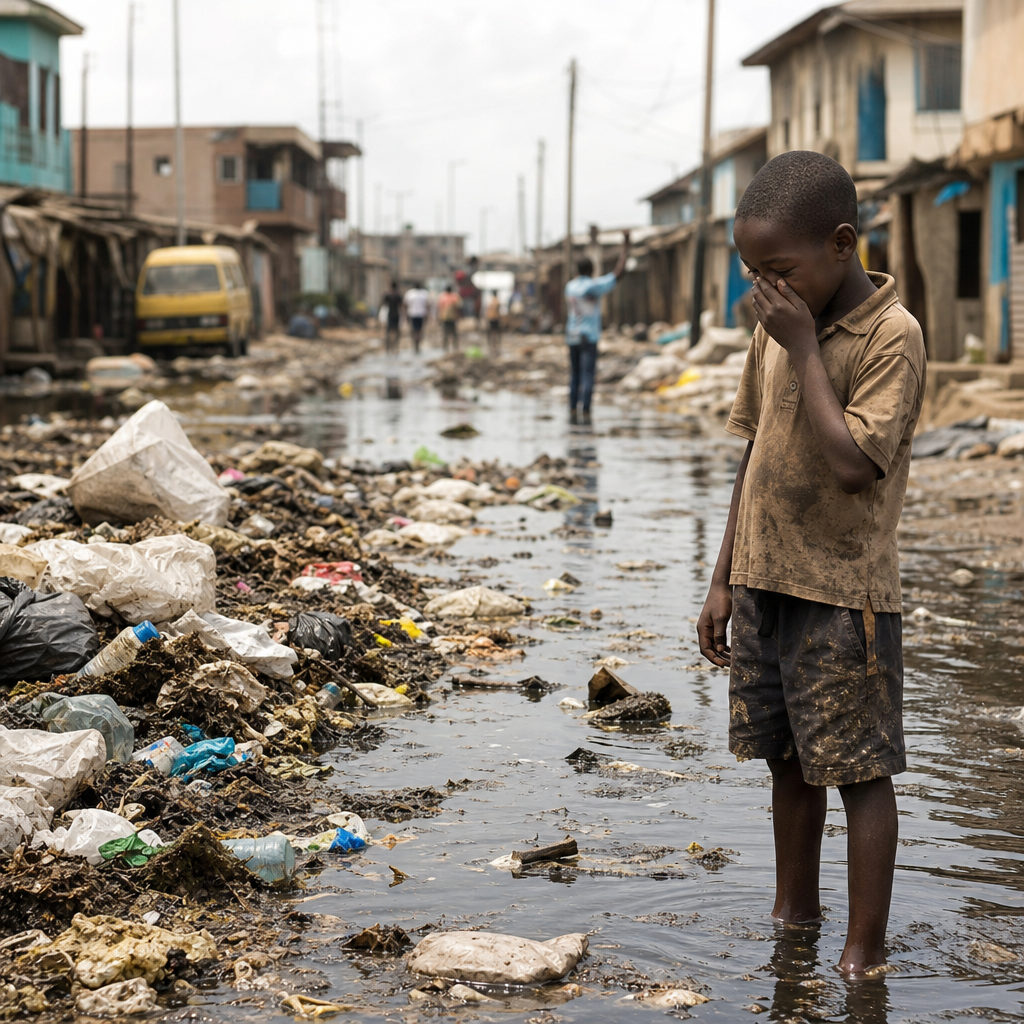
Leveraging big data and analytics in global sanitation management is transforming how governments, utilities, nonprofits, and multilateral agencies plan services, target investments, and measure health outcomes across cities, towns, and informal settlements. In sanitation, big data refers to large, fast-moving, and diverse datasets such as household surveys, satellite imagery, utility records, sensor feeds, mobile payment logs, climate data, and disease surveillance. Analytics is the disciplined process of turning that raw information into decisions: identifying service gaps, predicting equipment failure, mapping contamination risk, optimizing fecal sludge collection routes, and evaluating whether policy reforms actually improve equitable access. I have worked with sanitation datasets that looked complete on paper yet hid entire neighborhoods because addresses were inconsistent or households shared facilities; that experience makes one point clear. Better sanitation management depends not just on collecting more data, but on integrating, cleaning, and governing it well. This matters globally because sanitation is a public health system, an environmental protection system, and an economic productivity system at the same time. Poor sanitation contributes to diarrheal disease, stunting, groundwater contamination, lost school attendance, unsafe work, and urban flooding. Yet progress is uneven. According to the WHO and UNICEF Joint Monitoring Programme, billions of people still lack safely managed sanitation, and open defecation, inadequate wastewater treatment, and weak sludge management remain widespread in low-income and middle-income countries. Global initiatives increasingly recognize that the hardest sanitation problems are coordination problems. Municipalities need local operational data, ministries need national comparability, donors need accountability, and communities need visible service improvements. Big data and analytics connect those needs by creating a common evidence base for action.
Why data-driven sanitation has become central to global collaboration
Global sanitation initiatives now succeed or fail on the quality of shared information. Programs linked to the Sustainable Development Goals, citywide inclusive sanitation, climate adaptation, and public health emergency planning all require reliable baseline data and continuous performance tracking. The practical question is simple: who is unserved, what type of service do they use, where does waste go, and what risks follow from current conditions? Traditional monitoring, built mainly on periodic household surveys, is valuable but too slow to answer fast-moving operational questions. A city can complete a sanitation survey every three years and still miss illegal dumping hotspots that appeared last month or pumping stations likely to fail next week.
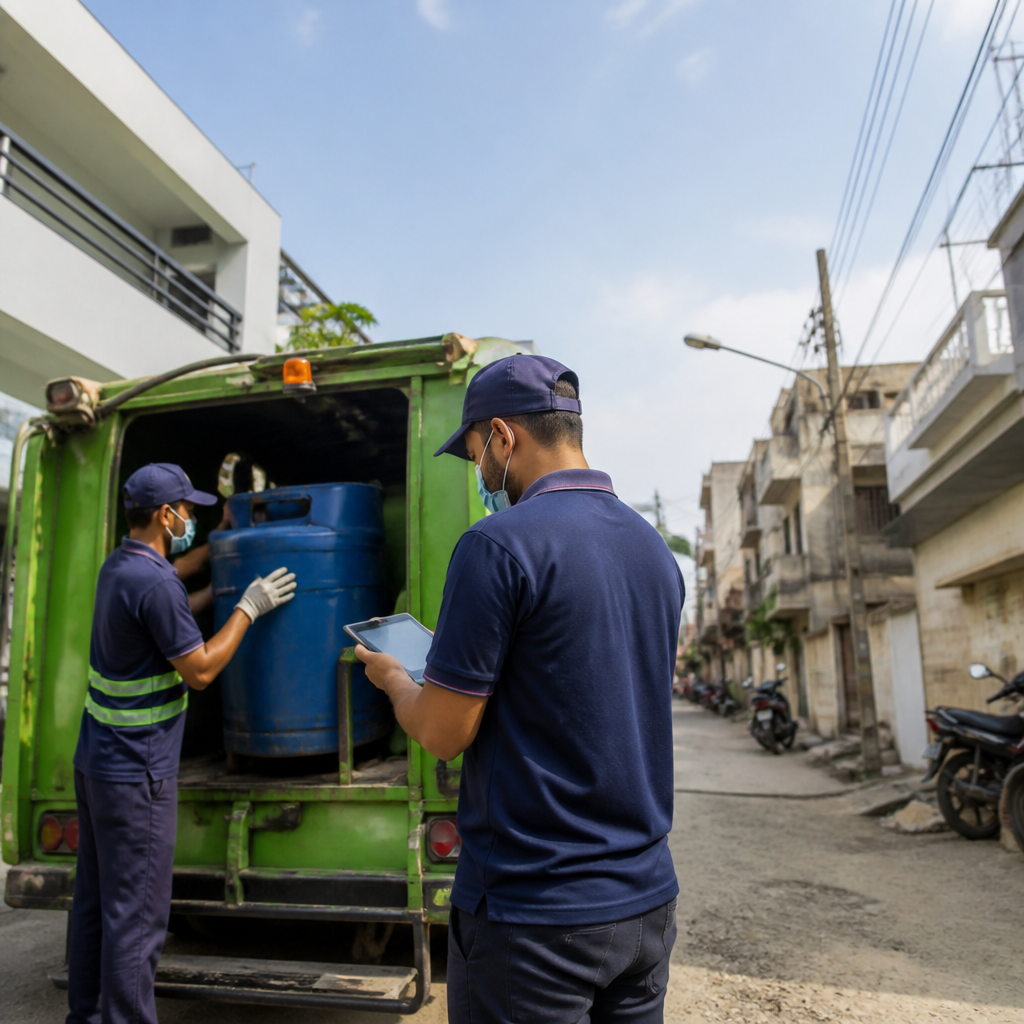
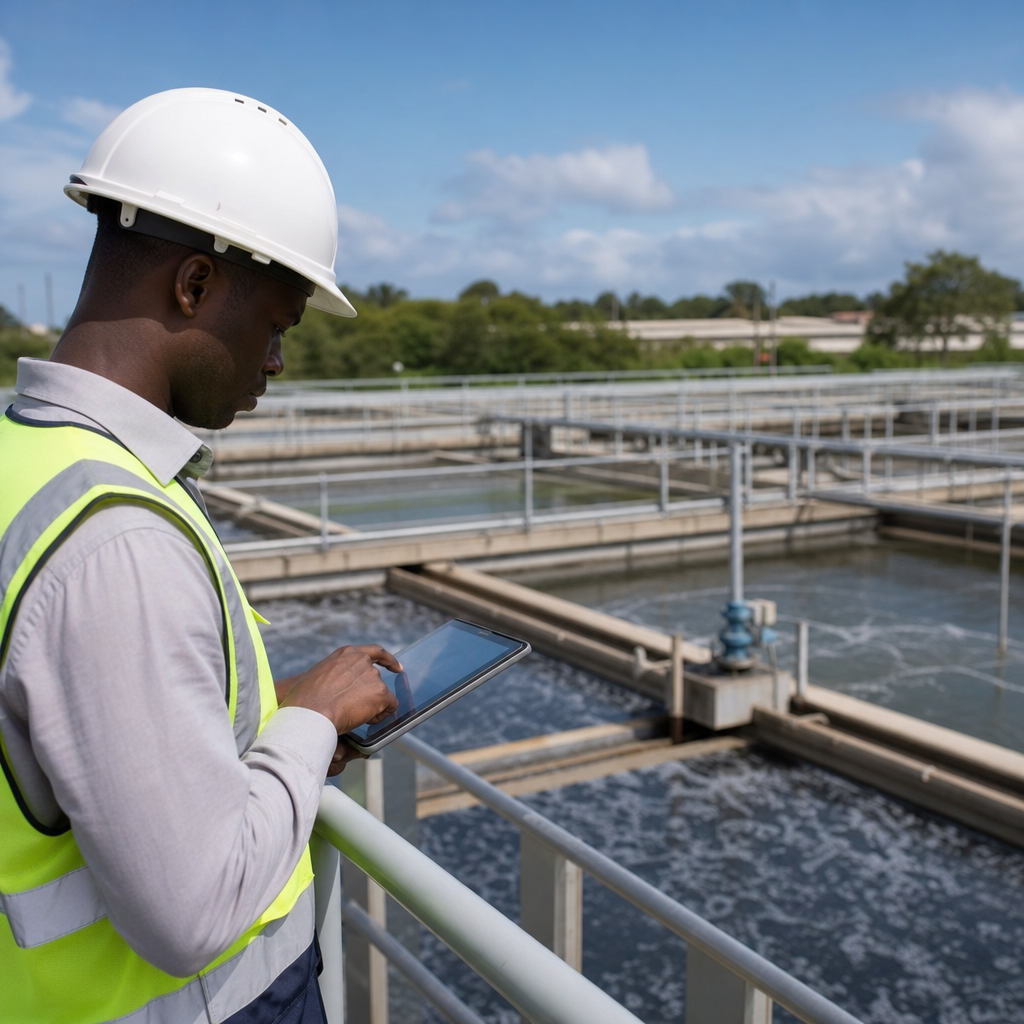
Big data fills those gaps by combining static and dynamic sources. Utilities use supervisory control and data acquisition systems to monitor wastewater flows and energy use. Septic and fecal sludge operators use GPS and route logs to see whether collection trucks are serving dense low-income areas or avoiding them. Public health teams compare cholera case data with rainfall, drainage maps, and settlement density to identify neighborhoods where sanitation failures create outbreak conditions. Remote sensing adds another layer by showing flood-prone zones, land use change, and settlement expansion where formal sewer networks are absent. When these datasets are brought together, collaboration becomes concrete rather than rhetorical. A ministry can set national standards, a city can identify priority wards, and development partners can fund interventions with measurable targets.
One lesson from large urban programs in Africa and South Asia is that sanitation planning improves when agencies stop treating sewer coverage as the only metric that matters. Analytics supports a full service chain view: containment, emptying, transport, treatment, reuse, and safe disposal. That broader perspective is essential for hub-level coverage of global initiatives and collaborations in sanitation because many successful models rely on onsite systems rather than universal sewerage. Data makes those models visible, comparable, and governable.
Key data sources and how they improve sanitation decisions
The most useful sanitation analytics programs blend household, environmental, operational, and financial data. Household surveys from national statistics offices, Demographic and Health Surveys, and Multiple Indicator Cluster Surveys help estimate access levels, shared facility use, and hygiene conditions. Administrative data from municipalities and utilities captures permits, service requests, treatment plant output, desludging schedules, and customer payments. Geospatial datasets from satellites, drones, and open mapping communities reveal settlement density, topography, road access, water bodies, and flood exposure. Environmental monitoring adds laboratory results for fecal coliforms, biochemical oxygen demand, nutrient loading, and groundwater contamination. Health surveillance contributes clinic visits, disease incidence, and outbreak alerts. Increasingly, mobile network data and digital payment records help estimate service demand and affordability patterns without waiting for long survey cycles.
Each source answers a different sanitation management question. If a city wants to know where to build treatment capacity, it needs population growth, sludge generation estimates, haul distances, and disposal compliance data. If it wants to reduce overflow incidents, it needs rainfall intensity, pipe condition records, blockage history, and maintenance response times. If a donor wants to support gender-responsive sanitation, it needs data on school toilets, menstrual hygiene facilities, public toilet safety, and service access in informal settlements. In my experience, the strongest programs resist the temptation to create one giant dashboard before agreeing on these decision questions. Good analytics begins with use cases, then identifies minimum viable data, then improves sophistication over time.
| Data source | Typical sanitation use | Example decision supported |
|---|---|---|
| Household surveys | Estimate access and service inequality | Target subsidies to wards with low safely managed coverage |
| Utility and municipal records | Track operations and asset performance | Prioritize pump station rehabilitation |
| Satellite and GIS layers | Map settlements, roads, flood risk | Site decentralized treatment near growing peri-urban areas |
| Health surveillance | Link sanitation failure to disease trends | Pre-position emergency desludging before cholera season |
| Mobile payments and GPS logs | Measure service demand and route efficiency | Optimize fecal sludge collection schedules |
Tools commonly used in these workflows include QGIS or ArcGIS for spatial analysis, KoboToolbox and SurveyCTO for field data collection, Power BI and Tableau for reporting, and statistical environments such as R and Python for forecasting and anomaly detection. The tool matters less than the governance around it: common definitions, version control, metadata, and clear ownership of updates.
Global initiatives using analytics to strengthen sanitation systems
Several major sanitation collaborations already show how analytics improves outcomes. The WHO and UNICEF Joint Monitoring Programme remains the global reference for comparable sanitation access estimates. Its strength is standardized methodology that allows countries and development institutions to benchmark progress. However, national estimates alone do not tell mayors where the next service intervention should happen. That is where city-focused approaches such as citywide inclusive sanitation have become influential. These programs use service chain mapping, neighborhood risk profiling, and business model analysis to improve sanitation for all residents, including those beyond sewer networks.
The World Bank, regional development banks, the Gates Foundation, UNICEF, WaterAid, and many national ministries have supported sanitation information systems that go beyond infrastructure counts. For example, shit flow diagrams, also called excreta flow diagrams, translate fragmented local data into a simple picture of whether waste is safely managed or unsafely discharged. They have helped cities from Dakar to Dhaka identify where containment fails, where transport breaks down, and whether treatment plants are operating below design performance. Because the visual is intuitive, it supports collaboration among engineers, public health officials, finance departments, and elected leaders who do not share the same technical vocabulary.
Another strong example is cholera preparedness. Countries with recurrent outbreaks increasingly combine rainfall forecasts, drainage maps, historical case clusters, and sanitation service gaps to guide emergency actions. Instead of responding only after clinics report surges, authorities can pre-position chlorine, inspect communal toilets, increase desludging, and protect water points in high-risk areas. In climate-vulnerable coastal cities, analytics also informs adaptation planning by showing where sea level rise, saline intrusion, and flood damage threaten sanitation assets. These applications demonstrate a larger truth: global sanitation collaboration works best when data is not only reported upward to donors, but also used locally for operations and resilience.
From raw data to action: practical analytics methods that work
Sanitation managers do not need exotic artificial intelligence to produce value. They need methods matched to the maturity of their systems. Descriptive analytics is the starting point. It summarizes current conditions through service coverage maps, plant utilization rates, complaint trends, and emptying frequency by neighborhood. Diagnostic analytics asks why problems occur, often by joining datasets that are rarely analyzed together. For instance, if illegal dumping rises in peripheral settlements, the cause may be a mix of long travel times to treatment sites, poor road access during rains, and tariff structures that push operators toward informal discharge. Predictive analytics estimates what will happen next, such as which pumps are likely to fail based on vibration and maintenance history or which wards face elevated overflow risk when rainfall exceeds a threshold. Prescriptive analytics goes one step further by recommending decisions, such as the most efficient collection routes or the treatment upgrade with the best cost-per-household served.
Real-world sanitation improvements often come from straightforward models. A municipality can use hotspot analysis to locate repeated septic overflow reports. A fecal sludge operator can apply route optimization to reduce fuel costs and increase daily jobs completed. A regulator can use control charts to detect sudden deterioration in effluent quality. A ministry can use cluster analysis to group districts with similar service constraints and tailor support packages instead of issuing one national template. In one project environment I observed, simply standardizing facility identifiers across public toilet inspection data and budget records revealed that maintenance funds were reaching some sites twice while other high-traffic facilities received nothing for months.
Plain language matters when explaining these methods. Decision-makers do not need to hear that a random forest classifier achieved marginal gains over logistic regression if the model cannot be maintained locally. They need to know whether the model is transparent, affordable, and accurate enough to improve outcomes. In sanitation, interpretability is usually more valuable than technical novelty because multiple agencies must trust and act on the results.
Barriers, risks, and the governance needed for trustworthy results
Despite its promise, big data in sanitation can mislead when governance is weak. The most common problem is fragmented data architecture. Utilities, health departments, urban planning offices, private desludging firms, and environmental regulators often store records in incompatible formats with different geographic boundaries and inconsistent definitions of service. If one dataset counts a shared toilet as access and another marks it inadequate, national reporting and local operations will diverge. Data quality problems are equally serious. Missing coordinates, duplicate customer accounts, uncalibrated sensors, and outdated asset registries can produce precise-looking dashboards that are wrong.
There are also ethical and political risks. Mapping sanitation deprivation at very fine scale can stigmatize communities if data is released carelessly. Mobile and payment records raise privacy concerns and must be governed under clear legal safeguards, minimization rules, and anonymization practices. Algorithmic bias is another issue. If predictive models rely heavily on formal service records, they may undercount informal settlements precisely because those areas have been historically excluded from reporting systems. Good sanitation analytics therefore requires validation with community enumerators, field inspections, and transparent assumptions.
Effective governance has several nonnegotiable elements: a shared data dictionary, documented indicators, role-based access controls, audit trails, update schedules, and independent quality checks. Open standards help. Using consistent geospatial reference systems, interoperable APIs, and metadata protocols reduces institutional friction. Procurement matters too. Many cities buy software before establishing workflows, then discover that staff cannot maintain the platform after consultants leave. The better sequence is governance first, then data model, then tooling, then training. Capacity building should include not only analysts but frontline inspectors, desludging operators, plant managers, and finance officers whose records feed the system.
How this hub guides broader work on global initiatives and collaborations in sanitation
As a hub article within global challenges and opportunities, this page frames the full landscape of global initiatives and collaborations in sanitation through the lens of evidence-based management. The central takeaway is that partnerships produce durable gains when they align financing, standards, operations, and accountability around shared data. Future deep-dive articles under this hub should examine multilateral funding mechanisms, transboundary wastewater governance, urban sanitation partnerships, emergency sanitation coordination, fecal sludge market development, digital monitoring platforms, and the role of community-led data collection. Each of those topics becomes clearer when readers understand the analytics foundation beneath them.
The practical benefit is straightforward. Big data and analytics help sanitation leaders move from assumptions to proof, from fragmented projects to system management, and from one-time reporting to continuous improvement. Start with a priority decision, assemble the minimum credible dataset, validate it with field reality, and build collaboration around the results. That approach consistently outperforms technology-first programs. If you are shaping sanitation policy, utility strategy, donor investments, or research, use this hub as your starting point and map every initiative back to the same question: how will better data produce safer, more inclusive sanitation at scale?
Frequently Asked Questions
What does big data and analytics mean in the context of global sanitation management?
In global sanitation management, big data refers to the large volume, variety, and speed of information that can be collected from many different sources related to sanitation access, infrastructure, service delivery, environmental conditions, and public health. This can include household surveys, census records, utility billing systems, fecal sludge tracking data, treatment plant performance logs, smart sensors, satellite imagery, mobile payment records, rainfall and flood maps, disease surveillance, and even anonymized mobility patterns. Analytics is the process of turning that raw information into useful insight through methods such as mapping, trend analysis, forecasting, statistical modeling, and machine learning.
Together, big data and analytics help decision-makers move beyond guesswork. Instead of relying only on occasional field visits or outdated reports, governments, utilities, nonprofits, and development agencies can identify where sanitation coverage is weakest, which communities face the highest health risks, where service systems are failing, and how resources can be allocated more effectively. In practice, this means sanitation planning becomes more evidence-based, more targeted, and more responsive to real conditions on the ground. It is especially valuable in rapidly growing cities, peri-urban areas, and informal settlements where traditional data collection often struggles to keep pace with change.
How can big data improve sanitation service planning and investment decisions?
Big data improves sanitation planning by helping organizations see patterns that are often invisible in fragmented or manually collected records. For example, combining population density maps, poverty data, flood risk, utility service records, and health indicators can reveal neighborhoods where sanitation needs are urgent but underserved. This allows planners to prioritize investments where they will produce the greatest health, environmental, and social benefit rather than spreading budgets too thinly or relying on political pressure alone.
Analytics also supports smarter infrastructure decisions. Historical service data can show where sewer networks are overloaded, where on-site sanitation systems are likely to fail, or where fecal sludge collection routes are inefficient. Predictive models can estimate how population growth, climate variability, or urban expansion will affect future sanitation demand. As a result, agencies can phase investments more strategically, choosing the right mix of sewers, decentralized systems, public toilets, sludge treatment facilities, and maintenance programs.
Another major advantage is accountability. When investments are tied to measurable indicators such as service uptime, collection frequency, treatment efficiency, customer payment behavior, or disease reduction, it becomes easier to evaluate whether programs are actually working. This is important for public sector budgeting, donor financing, and public-private partnerships alike. In short, big data helps sanitation leaders invest with more precision, reduce waste, and improve outcomes at scale.
What types of data are most useful for monitoring sanitation systems and public health outcomes?
The most useful sanitation datasets are usually the ones that can be linked across operational, environmental, demographic, and health dimensions. Operational data includes utility service logs, pit emptying records, treatment plant throughput, equipment maintenance reports, complaint systems, and sensor readings that track flow, blockages, overflow events, or water quality conditions. These datasets help managers understand whether sanitation services are functioning reliably and where breakdowns are happening.
Demographic and socioeconomic data is equally important because sanitation challenges are closely tied to income, housing quality, settlement patterns, land tenure, and population growth. Household surveys, census data, and geospatial settlement mapping can show who lacks access to safe sanitation, where shared facilities are overburdened, and which communities are most vulnerable to exclusion. Satellite imagery and remote sensing can further support this by detecting land use changes, flood-prone zones, informal expansion, and environmental degradation near sanitation infrastructure.
Public health and climate data add another critical layer. Disease surveillance can help connect sanitation gaps with outbreaks of diarrhea, cholera, typhoid, or parasitic infections. Rainfall, temperature, groundwater, and flood data can explain why systems fail seasonally or why contamination risks increase in certain periods. When all of these data streams are integrated carefully, sanitation managers can move from simply tracking assets to understanding the broader health and resilience impacts of sanitation systems.
What are the biggest challenges in using big data and analytics for sanitation programs worldwide?
One of the biggest challenges is data quality. Sanitation data is often incomplete, inconsistent, outdated, or collected in different formats by different institutions that do not coordinate well. A utility may track sewer connections, a health ministry may track disease incidence, and a municipal department may hold records on pit emptying or public toilets, but none of these systems may align. Without standard definitions, interoperable databases, and routine validation, even large volumes of data can produce weak or misleading conclusions.
Another major challenge is institutional capacity. Collecting data is not the same as using it well. Many sanitation agencies face shortages of trained analysts, GIS specialists, data engineers, and managers who can interpret dashboards and translate findings into policy or operational change. There may also be budget constraints, weak digital infrastructure, or limited procurement systems for software, sensors, and cloud tools. In lower-resource settings, sustaining analytics programs after a pilot phase can be particularly difficult.
Privacy, ethics, and inclusion are also central concerns. Data drawn from mobile records, household surveys, or geolocated infrastructure can expose sensitive information if not governed properly. There is also a risk that communities with the least digital visibility, especially informal settlements or rural populations, may be underrepresented in the data and therefore overlooked in planning. Strong governance frameworks, transparent data-sharing rules, community engagement, and equity-focused analysis are essential to ensure that big data strengthens sanitation justice rather than deepening existing disparities.
How can organizations get started with data-driven sanitation management in a practical and scalable way?
The best starting point is not trying to collect every possible dataset at once. Organizations should begin by defining a few clear operational or policy questions, such as which neighborhoods have the highest sanitation risk, where service interruptions are happening most often, or which fecal sludge transport routes are least efficient. Once those priorities are identified, teams can map what data already exists, assess its quality, and fill only the most important gaps. This approach keeps early efforts manageable and tied directly to decision-making.
It is also important to build a simple but reliable data foundation. That may include digitizing paper records, standardizing reporting formats, assigning geographic coordinates to facilities, integrating complaint systems with service logs, and creating basic dashboards for managers. Open-source GIS tools, cloud-based databases, and mobile data collection platforms can make this more affordable than many organizations expect. Pilot projects should focus on producing visible wins, such as faster response to overflows, better route planning for desludging, or clearer targeting of subsidies for low-income households.
Over time, organizations can scale by investing in staff training, cross-agency data sharing, and governance structures that define who owns data, who can access it, and how it will be protected. Partnerships with universities, technology firms, public health agencies, and community organizations can accelerate progress while ensuring that analytics remains grounded in real service needs. The most successful data-driven sanitation programs are not just technology projects. They are management reforms that combine data, operational discipline, local knowledge, and long-term commitment to equitable service delivery.