Innovative tools for health monitoring in sanitation projects are reshaping how teams protect communities, measure risk, and improve outcomes across toilets, wastewater systems, and resource-recovery programs. In the EcoSan context, health monitoring means the structured collection and interpretation of data that shows whether sanitation systems are reducing exposure to pathogens, chemicals, vectors, and unsafe handling practices. EcoSan, short for ecological sanitation, treats human waste as a resource that can be safely transformed into fertilizer, soil conditioner, water, or energy when systems are designed and managed correctly. That promise matters because sanitation failures still drive diarrheal disease, parasitic infection, antimicrobial resistance, and environmental contamination, especially where utilities, clinics, and local governments lack timely data.
I have worked with sanitation teams that relied on monthly inspection forms and delayed lab results, and the gap between a field problem and a health response was often weeks too long. Today, affordable sensors, mobile reporting platforms, digital dashboards, rapid diagnostics, and geospatial tools let project managers detect failures earlier and target interventions with precision. For a hub page on enhancing health through EcoSan, the central point is simple: health gains do not come from toilets alone. They come from continuous monitoring across the entire sanitation chain, from user behavior and containment to transport, treatment, reuse, and worker protection. When projects instrument that chain with the right tools, they can prove impact, reduce outbreaks, strengthen compliance, and make ecological sanitation both safer and more credible.
Why health monitoring is essential in EcoSan projects
Health monitoring is essential because EcoSan systems create benefits only when biological treatment, storage times, moisture control, and handling protocols consistently interrupt disease transmission. Urine-diverting dry toilets, composting toilets, biodigesters, sludge drying beds, and decentralized wastewater treatment units all depend on operational discipline. If a dehydration vault remains too wet, if compost temperatures stay too low, or if operators skip protective equipment during sludge handling, pathogen reduction may be incomplete. Monitoring provides the evidence needed to verify that barriers are working.
In practical terms, projects should track both process indicators and outcome indicators. Process indicators include pH, temperature, moisture content, retention time, free chlorine where disinfection is used, handwashing station functionality, and personal protective equipment availability. Outcome indicators include E. coli counts, helminth egg viability, diarrheal case trends, vector presence, worker illness reports, and contamination detected in nearby soil or water. The World Health Organization sanitation safety planning approach is useful here because it focuses on identifying hazardous events, assigning control measures, and validating performance at each step.
Without monitoring, teams often confuse infrastructure delivery with public health protection. I have seen sites with neatly built toilets but overflowing collection points, unsafe ash dosing, and no record of reuse product quality. Those projects looked successful in construction reports yet carried preventable risks. Strong health monitoring corrects that blind spot. It turns EcoSan from a hardware program into a risk-managed public health system with measurable safeguards.
Digital data collection and mobile reporting tools
Mobile data collection is usually the fastest upgrade a sanitation project can make. Platforms such as KoboToolbox, CommCare, Open Data Kit, and SurveyCTO allow field workers to capture inspections, household surveys, incident reports, and maintenance logs on phones or tablets, even offline. Once synced, that data feeds dashboards that supervisors can review daily instead of waiting for paper forms to be entered. For EcoSan projects, mobile forms can standardize checks for vault fill level, urine diversion function, odor, fly presence, handwashing supplies, treatment batch dates, and reuse product movement.
The health benefit of digital reporting is speed combined with structure. A field enumerator can photograph a cracked slab, geotag a blocked drain, record whether children are using the toilet correctly, and escalate a high-risk issue immediately. Skip logic improves data quality by forcing relevant follow-up questions. Required fields reduce missing records. Time stamps help verify when inspections occurred. This matters in decentralized sanitation, where hundreds of dispersed sites can drift out of compliance if managers lack visibility.
These tools also support longitudinal analysis. If a project tracks every service visit, managers can see whether a certain toilet model has higher failure rates in humid areas, whether training reduces unsafe emptying, or whether disease complaints cluster around sites with delayed collection. In my experience, the most effective teams keep mobile forms short, define each indicator precisely, and train supervisors to close the loop by acting on exceptions rather than merely collecting data.
Sensors, rapid diagnostics, and laboratory innovations
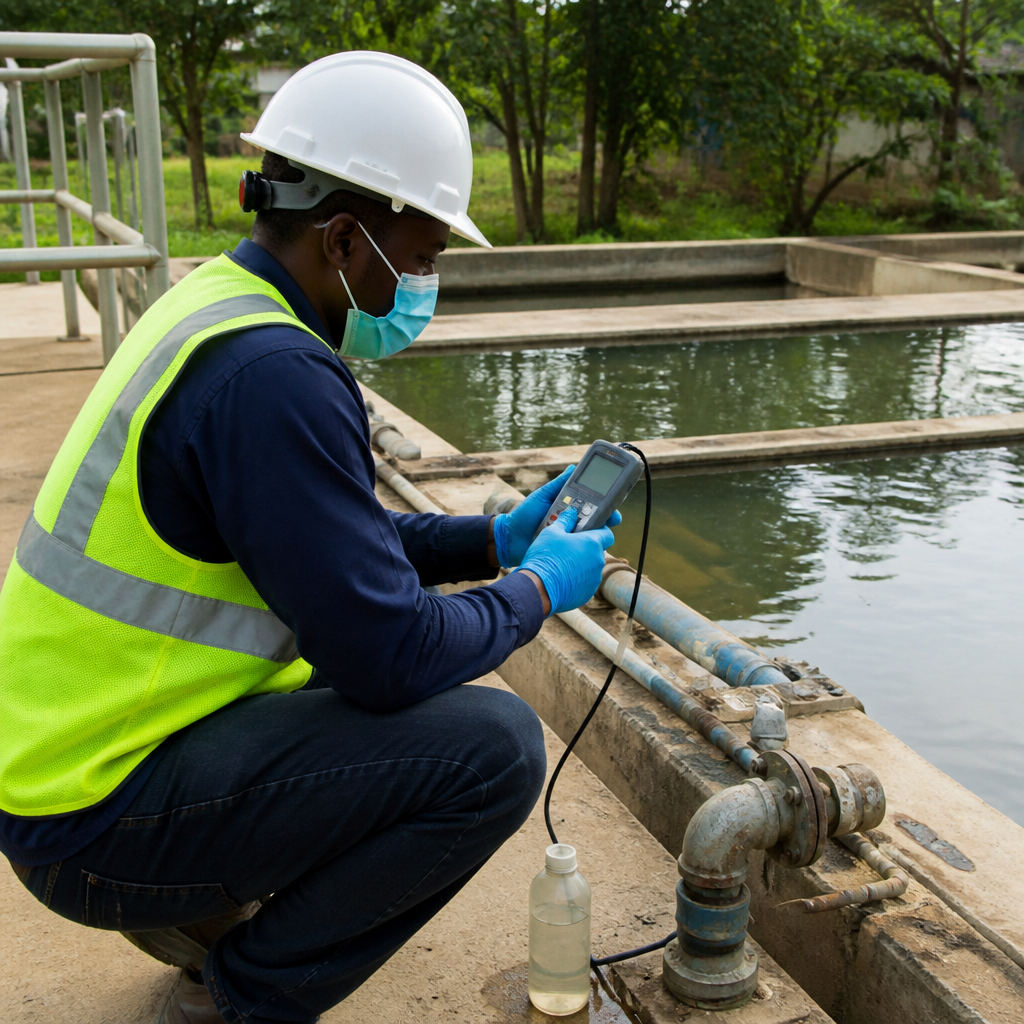
Sensor technology is improving the reliability of sanitation health monitoring, especially where laboratory capacity is limited. Temperature probes, moisture sensors, pH meters, conductivity meters, and level sensors can validate treatment conditions or flag overflow risk. In composting systems, sustained thermophilic temperatures support pathogen reduction. In urine storage and nutrient recovery systems, pH and conductivity help operators understand stabilization and dilution patterns. In septic or holding tanks, level sensors can trigger timely emptying before spills occur.
Rapid microbiological methods are equally important. Portable incubators and compact test kits for indicator bacteria such as E. coli can provide near-field evidence of contamination. Helminth monitoring remains more specialized, but microscopy protocols and reference laboratories can verify whether fecal sludge or compost meets reuse thresholds. Emerging methods, including qPCR and environmental surveillance workflows, allow projects and public health authorities to detect specific pathogens with higher sensitivity, although cost, training, and sample transport remain constraints.
For many EcoSan programs, the best model is tiered monitoring: simple field instruments for daily operational control, periodic rapid tests for routine verification, and accredited laboratory testing for validation and audit. That approach balances cost with confidence. It also prevents a common mistake: relying on a single measurement. Safe sanitation depends on multiple barriers, so projects should combine process control data with microbiological evidence, worker exposure records, and environmental sampling where justified.
| Tool | What it measures | Typical EcoSan use | Main limitation |
|---|---|---|---|
| Mobile inspection app | Operational checks, photos, GPS, timestamps | Routine toilet and treatment site inspections | Needs disciplined form design and follow-up |
| Temperature and moisture sensors | Composting or dehydration conditions | Verifying treatment performance | Sensor maintenance and calibration |
| Portable E. coli test kit | Indicator bacteria in water or reuse products | Spot checks for contamination | Does not identify all pathogens |
| GIS dashboard | Spatial patterns of risk and service gaps | Targeting interventions by location | Depends on accurate geocoded data |
| Worker health log | Symptoms, exposure incidents, vaccination status | Occupational safety management | Requires confidentiality and supervision |
GIS, dashboards, and decision support for outbreak prevention
Geographic information systems and dashboards turn scattered sanitation records into actionable intelligence. Tools such as QGIS, ArcGIS, Power BI, Tableau, and DHIS2 can map facility conditions, treatment performance, service routes, complaint hotspots, flood-prone areas, and disease reports. When that information is layered, project teams can identify where sanitation risk overlaps with vulnerable populations, schools, markets, or shallow groundwater sources.
This spatial view is especially valuable in dense settlements and climate-stressed areas. After heavy rainfall, for example, sites with poor drainage, full containment units, and informal sludge dumping can be prioritized for inspection before contamination spreads. If a district dashboard shows repeated latrine failure near a health clinic, teams can investigate whether design standards are unsuitable for high groundwater or whether cleaning contracts are underperforming. Dashboards also help communicate with funders and local authorities because trends become visible rather than anecdotal.
Good decision support systems do more than display red, yellow, and green indicators. They define thresholds and link them to actions. A high tank level should create a work order. A failed microbiological sample should trigger resampling, temporary reuse restrictions, and operator retraining. A cluster of worker needle-stick or splash incidents should trigger safety review, PPE checks, and immunization follow-up. Dashboards are most useful when every indicator has an owner, a response protocol, and a review cadence.
Monitoring occupational health and community behavior
EcoSan health monitoring often overlooks the people with the highest direct exposure: emptiers, transport workers, treatment operators, sorters, and reuse handlers. Occupational health tools should therefore be built into every project. Digital worker health logs can record training completion, hepatitis and tetanus vaccination status, PPE issuance, exposure incidents, heat stress reports, and missed work due to illness. Simple supervisory checklists can verify glove quality, mask use where aerosols are possible, handwashing compliance, and safe loading procedures.
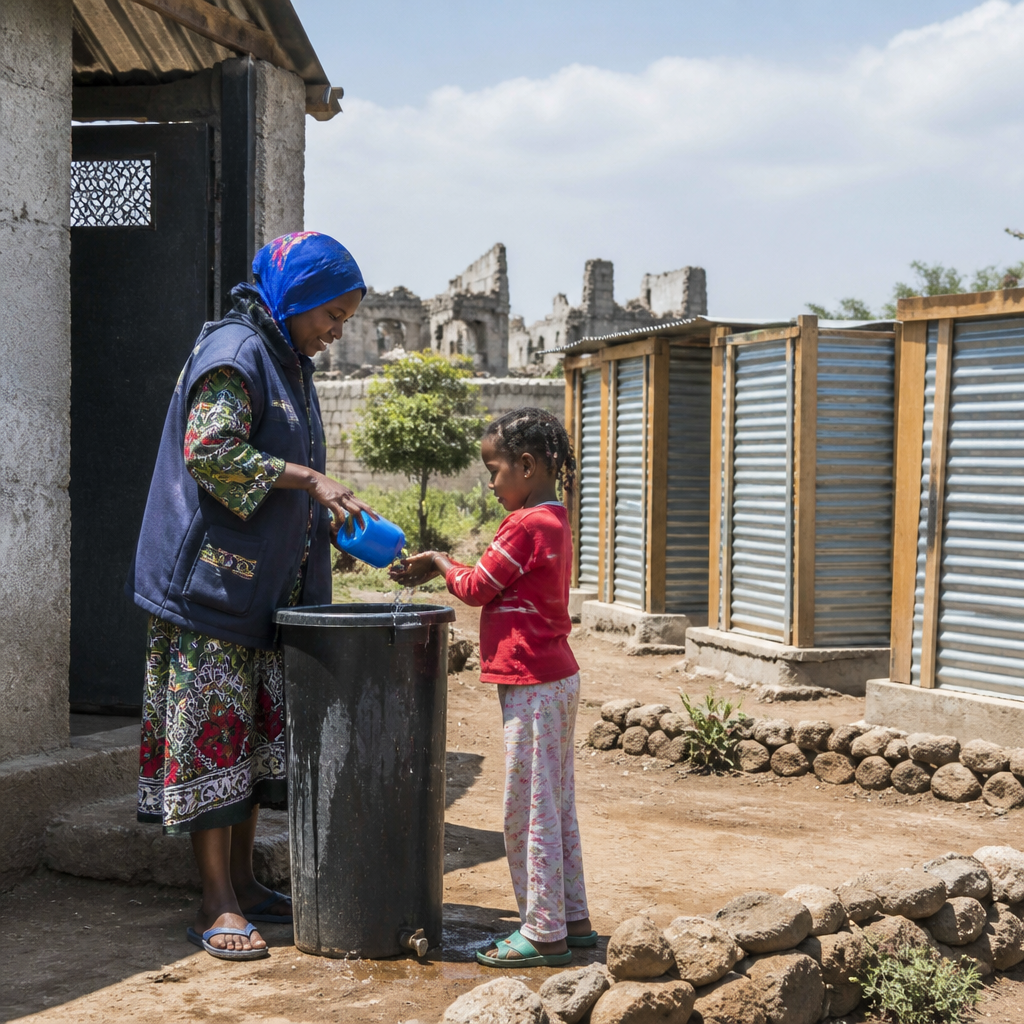
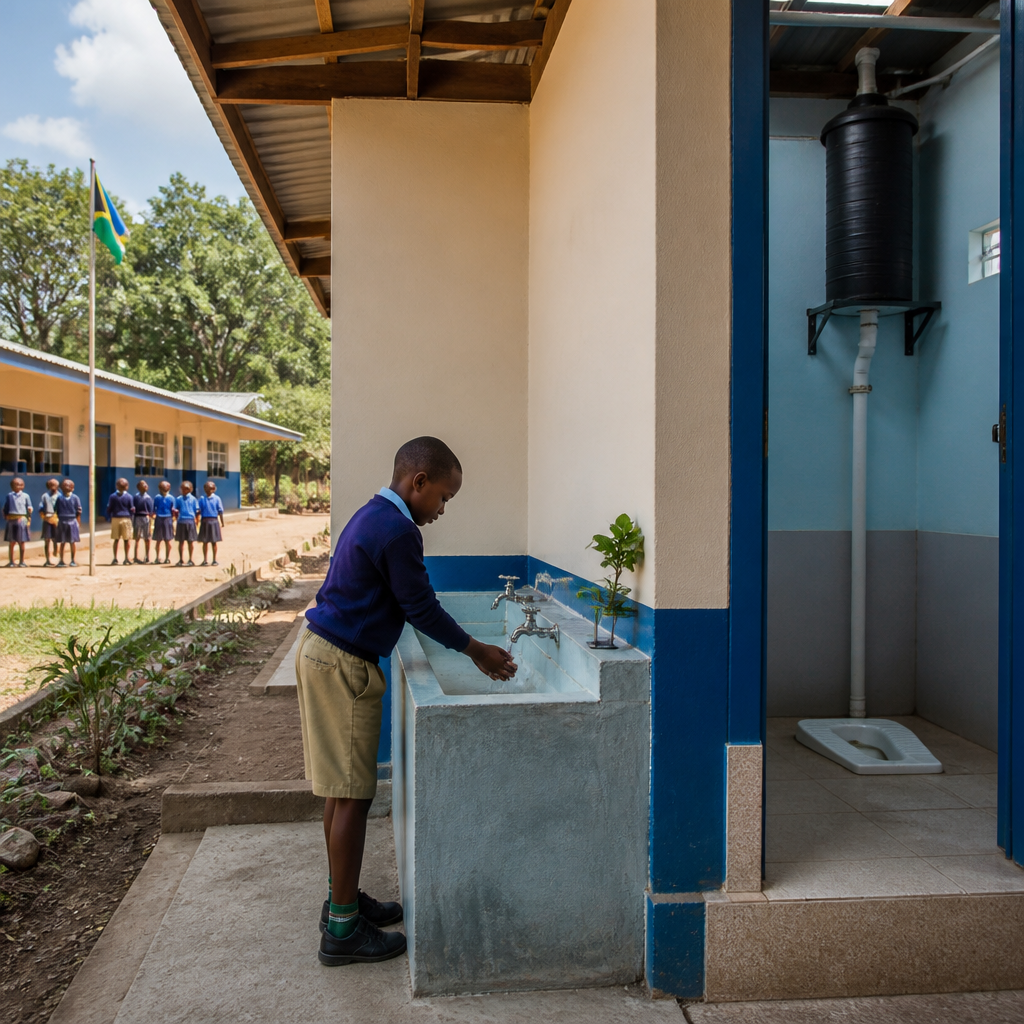
Behavior monitoring in households and institutions matters just as much. A well-designed urine-diverting toilet fails quickly if users add wash water to the wrong chamber, neglect ash or cover material, or allow children to misuse the interface. Structured observations, short user interviews, complaint tracking, and QR-code service request systems can reveal these issues early. In schools, soap availability, menstrual hygiene support, and cleaning frequency strongly influence whether facilities are used consistently enough to produce health benefits.
The most useful insight I have seen from behavior data is that technical failure is often social failure in disguise. When projects only measure infrastructure status, they miss why facilities decline. Monitoring should therefore pair engineering indicators with user comprehension, trust in reuse products, willingness to pay for maintenance, and stigma around handling treated excreta. Those human factors directly affect contamination risk and long-term adoption.
Building a practical monitoring framework for safer reuse
A practical framework starts with the sanitation chain and asks four questions at each step: what can go wrong, what indicator will reveal it, how often should it be checked, and who must act if the indicator fails. For containment, indicators may include structural integrity, leakage, vector access, and user adherence. For collection and transport, they may include spill incidents, route completion, and equipment disinfection. For treatment, they include retention time, temperature, moisture, pH, and laboratory verification. For reuse, they include storage conditions, application methods, and restrictions for crops or contact scenarios.
Projects should then classify indicators into leading and lagging measures. Leading indicators predict risk before harm occurs, such as rising moisture in dehydration vaults or repeated missed emptying appointments. Lagging indicators confirm that harm or failure has already happened, such as contaminated runoff, worker illness, or community complaints after odor episodes. Both are necessary, but leading indicators deserve operational attention because they support prevention.
Governance is the final piece. Monitoring fails when data ownership is vague, response budgets are absent, or standards are not defined. Successful EcoSan programs align indicators with local regulations, reuse guidelines, and public health reporting systems. They schedule calibration, data quality audits, and periodic protocol review. Most importantly, they communicate findings in plain language to operators, local officials, and communities so that corrective action is accepted and sustained.
Conclusion
Innovative tools for health monitoring in sanitation projects make EcoSan safer, more accountable, and more effective by revealing risks before they become outbreaks or chronic exposure problems. Mobile reporting platforms improve speed and consistency. Sensors and rapid diagnostics strengthen operational control and verification. GIS and dashboards help teams see patterns, target resources, and respond quickly. Worker health tracking and behavior monitoring ensure that the people operating and using systems are protected, not treated as an afterthought.
For any organization building this health and safety hub, the core lesson is clear: enhancing health through EcoSan requires monitoring the full sanitation chain, not just installing facilities. Start with a small, disciplined indicator set, define thresholds and responsibilities, validate with periodic laboratory testing, and use the results to improve design, training, and maintenance. If you are planning or upgrading an EcoSan program, map your risks, choose the right tools for each control point, and turn health monitoring into a routine management function rather than a one-time study.
Frequently Asked Questions
What does health monitoring mean in sanitation projects, especially in an EcoSan setting?
Health monitoring in sanitation projects refers to the organized process of collecting, analyzing, and using information to understand whether a sanitation system is actually protecting people and the environment. In an EcoSan setting, this goes beyond simply checking whether toilets are built or wastewater is moved from one place to another. It focuses on whether the system reduces exposure to disease-causing pathogens, harmful chemicals, disease vectors such as flies and mosquitoes, and unsafe handling practices across the full sanitation chain.
Because ecological sanitation views human waste as a resource that can be safely treated and reused, monitoring must be more comprehensive than in conventional systems. Teams need to know whether urine diversion toilets are functioning properly, whether fecal sludge or composted material reaches safe treatment targets, whether wastewater systems are containing contamination, and whether workers and households are following safe practices. This often includes tracking microbial indicators, treatment temperatures, moisture levels, storage time, groundwater quality, user behavior, and occupational health conditions.
Innovative tools strengthen this work by making data collection faster, more accurate, and easier to act on. Mobile survey apps, digital inspection forms, GIS mapping, remote sensors, field diagnostic kits, and data dashboards help project teams move from assumptions to evidence. Instead of relying only on occasional site visits or paper records, teams can identify patterns early, compare risks across locations, and respond before small failures become public health problems. In short, health monitoring is the evidence system that shows whether sanitation investments are truly delivering safer outcomes.
Which innovative tools are most useful for health monitoring in sanitation projects?
The most useful tools are usually the ones that connect field realities with timely decision-making. Mobile data collection platforms are among the strongest starting points because they allow inspectors, operators, and community workers to record observations in real time using smartphones or tablets. They can capture sanitation facility condition, sludge handling practices, protective equipment use, odor complaints, standing water, and signs of leakage or contamination. When paired with geotagging and time stamps, this information becomes far more reliable and actionable than paper-based systems.
Sensor-based technologies are also becoming increasingly valuable. Temperature and moisture sensors can be used in composting or sludge treatment processes to confirm that conditions are reaching levels associated with pathogen reduction. Flow meters and water quality probes can support wastewater monitoring by showing changes in system performance, overflow events, or contamination trends. In some projects, low-cost Internet of Things devices provide near-real-time alerts when tanks are too full, treatment conditions fall outside safe ranges, or equipment malfunctions.
Field testing tools remain essential as well. Rapid diagnostic kits for microbial indicators, chlorine residual, pH, turbidity, and nutrient levels can help teams assess whether treatment and containment are working. GIS and spatial analysis tools add another layer of value by mapping sanitation assets against disease hotspots, flood-prone zones, groundwater vulnerability, or population density. Finally, dashboard and analytics platforms tie all of this together. They help managers compare sites, monitor trends over time, prioritize maintenance, and communicate results clearly to funders, regulators, and communities. The best toolset is rarely a single device; it is an integrated monitoring system built around the project’s risks, budget, and operational capacity.
How do these tools help reduce health risks in toilets, wastewater systems, and resource-recovery programs?
Innovative health monitoring tools reduce risk by making hazards visible earlier and more consistently. In toilet systems, digital inspections and user reporting tools can reveal blocked vents, overflowing pits, damaged slabs, poor handwashing access, or evidence of unsafe cleaning and emptying practices. Those issues may seem routine, but they often drive direct exposure to pathogens and vectors. When teams can detect and document these failures quickly, they can intervene before contamination spreads within households, schools, healthcare facilities, or dense settlements.
In wastewater systems, monitoring tools are especially important because many failures are not obvious until they have already created a public health problem. Sensors, sampling programs, and remote reporting can identify pump breakdowns, illegal discharges, leakage, bypasses, and declining treatment efficiency. Water quality testing upstream and downstream of treatment points helps determine whether communities, irrigation users, or ecosystems are being exposed to unsafe effluent. This allows operators to shift from reactive crisis management to preventive maintenance and targeted corrective action.
Resource-recovery programs introduce additional benefits and additional responsibilities. If treated biosolids, compost, urine, or reclaimed water are going to be reused, project teams must verify that treatment barriers are working and that reuse practices are safe. Monitoring tools can track storage duration, temperature profiles, laboratory results, application methods, transport conditions, and worker protection measures. This protects farmers, transporters, nearby residents, and consumers while also building confidence in circular sanitation approaches. The overall value is simple but powerful: better monitoring leads to faster detection, better compliance, safer operations, and stronger public trust.
What indicators should teams track to measure whether sanitation projects are improving health outcomes?
Teams should track a mix of operational, environmental, behavioral, and health-related indicators because no single metric can fully capture sanitation safety. Operational indicators show whether infrastructure and treatment systems are functioning as intended. These may include toilet usability, fill levels, containment integrity, frequency of desludging, treatment retention time, compost temperature, moisture content, equipment downtime, and safe transport completion rates. If these basic performance indicators are weak, health protection is likely to be weak as well.
Environmental indicators help determine whether contamination is escaping into the wider community. Common examples include E. coli or fecal indicator bacteria in water sources, nutrient concentrations, turbidity, pH, groundwater contamination trends, surface water quality near discharge points, and vector presence around facilities or waste storage areas. In EcoSan and reuse settings, testing treated outputs for relevant microbial and chemical parameters is particularly important before agricultural or landscape application.
Behavioral and occupational indicators are equally critical. These include handwashing compliance, use of personal protective equipment, frequency of unsafe manual handling, adherence to separation and storage protocols, household acceptance of sanitation practices, and reporting of exposure incidents among workers. Where feasible, teams may also link monitoring to broader public health indicators such as diarrheal disease trends, helminth prevalence, skin or eye irritation complaints, or school and workplace absenteeism patterns. However, those health outcomes should be interpreted carefully, since many external factors influence them. The strongest monitoring frameworks combine process indicators that can be managed directly with outcome indicators that show whether protective measures are translating into real-world benefits.
What are the biggest challenges when introducing innovative monitoring tools, and how can projects overcome them?
One of the biggest challenges is assuming that technology alone will solve monitoring problems. Many sanitation projects adopt apps, sensors, or dashboards without a clear plan for what decisions the data should support. As a result, teams collect large volumes of information that are incomplete, inconsistent, or never used. The solution is to start with a risk-based monitoring framework. Projects should define the most important hazards, the indicators that best reflect those hazards, who is responsible for collecting data, how often data should be reviewed, and what action should follow when results exceed defined thresholds.
Capacity is another major issue. Field staff may need training in digital tools, sampling methods, data interpretation, equipment maintenance, and safe handling procedures. Connectivity, electricity, replacement parts, calibration needs, and software licensing can also limit performance, especially in low-resource settings. To overcome this, successful programs often choose durable, low-cost, easy-to-maintain tools that match local conditions rather than chasing the most advanced technology. They also build in refresher training, technical support, offline functionality, and simple standard operating procedures.
Data quality and trust matter as much as data collection. If monitoring information is inaccurate, delayed, or poorly explained, it can mislead managers and weaken community confidence. Projects should use validation checks, supervision, periodic audits, and clear data governance practices to protect quality. Privacy and ethics should also be considered, particularly when monitoring household behaviors or worker health. Finally, community engagement is essential. People are more likely to support sanitation monitoring when they understand its purpose, see that findings lead to practical improvements, and trust that the project is using data to protect health rather than merely to satisfy reporting requirements. The most effective sanitation monitoring systems are not just innovative; they are practical, transparent, and embedded in everyday operations.