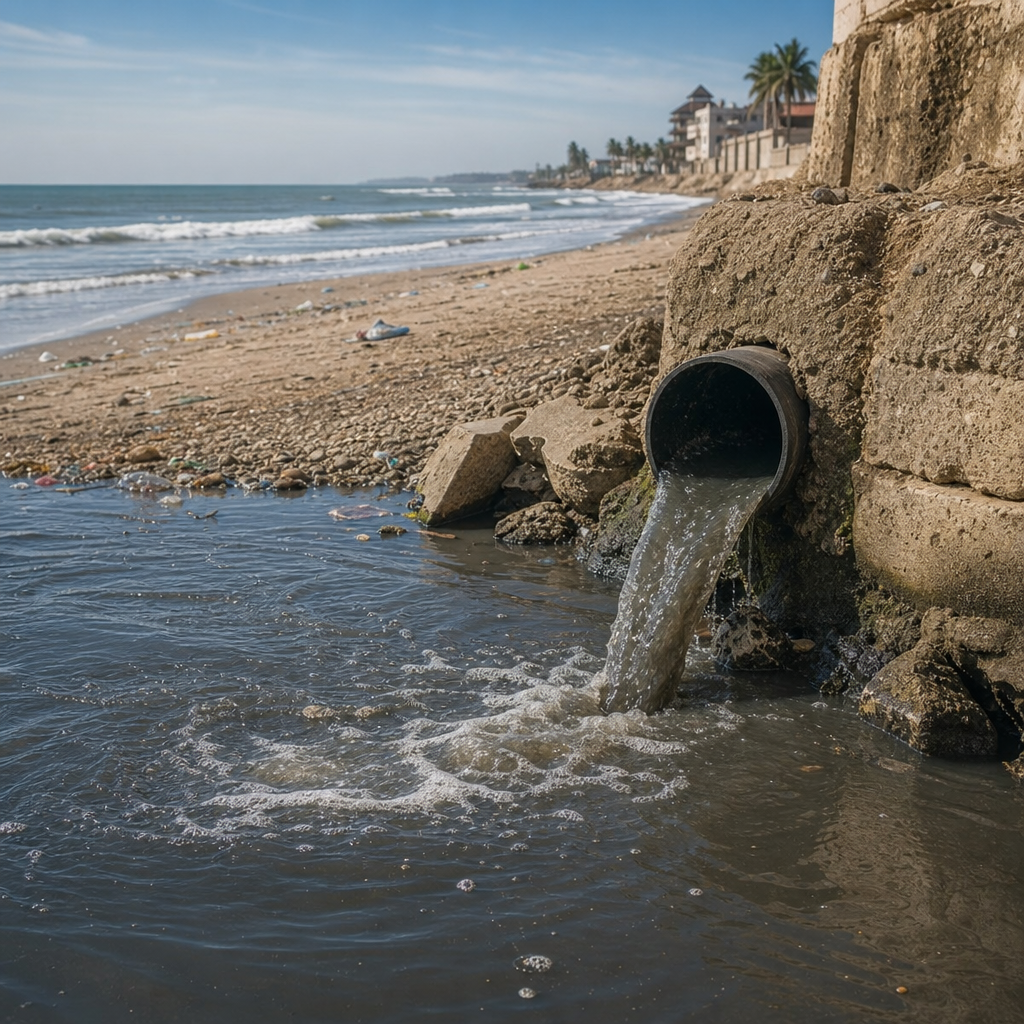
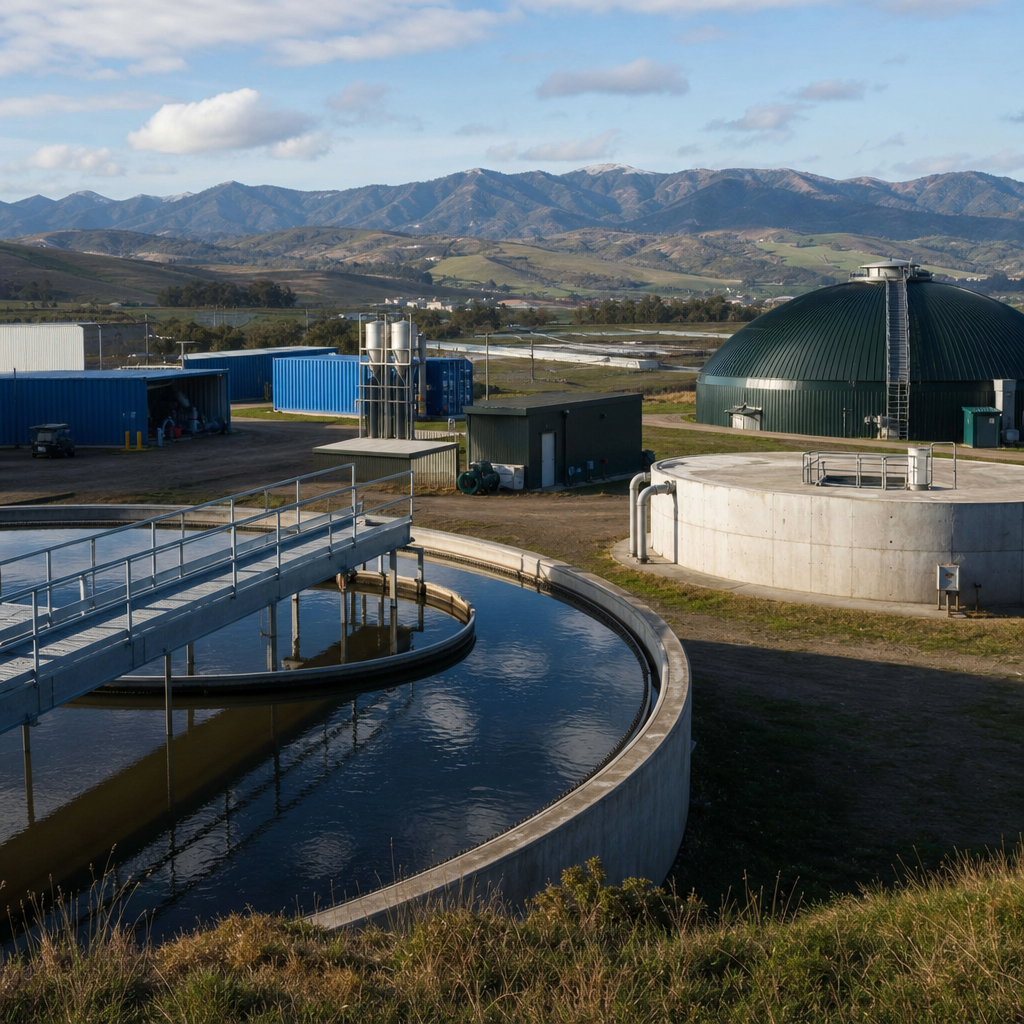
The carbon footprint of different sanitation systems is a practical question with climate, public health, and infrastructure implications, especially for anyone evaluating EcoSan and the environment across cities, rural settlements, schools, housing projects, and emergency contexts. A sanitation system includes the full chain from toilet interface and user behavior to storage, transport, treatment, reuse, and final disposal. Carbon footprint refers to greenhouse gas emissions expressed as carbon dioxide equivalent, usually including carbon dioxide, methane, and nitrous oxide. In sanitation, those gases come from electricity use, fuel for pumping and hauling, decomposition in pits, septic tanks, lagoons, and sewers, chemical inputs, construction materials, and sludge treatment. The choice between flush toilets, septic systems, pit latrines, composting toilets, urine-diverting dry toilets, container-based sanitation, and sewered treatment plants therefore shapes both environmental impact and service quality.
I have worked on sanitation planning where teams focused almost entirely on capital cost and user preference, then discovered later that operational energy, sludge logistics, and methane losses dominated long-term emissions. That pattern is common. A toilet that looks low impact at the household level can perform poorly once overflowing pits, tanker transport, and untreated discharges are counted. Conversely, a system with higher upfront material use can cut total emissions if it avoids anaerobic methane generation, reduces water demand, and recovers nutrients that displace synthetic fertilizer. This is why hub discussions about EcoSan and the environment must examine the entire service chain rather than the toilet alone. It also explains why carbon results vary widely between countries, settlement patterns, climate zones, groundwater conditions, and treatment standards.
EcoSan, short for ecological sanitation, is not one single technology. It is a design approach that treats human excreta and wastewater as resources to be safely managed and, where appropriate, reused. Common EcoSan systems include urine-diverting dry toilets, composting toilets, dehydrating vaults, blackwater separation, and source-separated collection linked to nutrient recovery. The environmental goal is to protect water, conserve nutrients, reduce pollution, and often lower energy use. Carbon performance matters because sanitation contributes more to emissions than many planners assume. Research summarized by the International Water Association, the Stockholm Environment Institute, and the Intergovernmental Panel on Climate Change shows that methane and nitrous oxide from wastewater and excreta management are significant non-carbon dioxide climate pollutants. In poorly managed systems, they can outweigh emissions from electricity or cement.
For decision-makers, the key question is not which system is universally best. The right question is which sanitation system delivers the lowest feasible emissions while meeting health, affordability, dignity, and operational reliability requirements in a specific context. That framing leads to better choices. A dense city with a functioning wastewater treatment plant may need sewer optimization and energy recovery. A peri-urban area with unreliable desludging may perform better with container-based or source-separated systems. A dry rural area may gain both climate and water benefits from urine diversion. Understanding the carbon footprint of different sanitation systems is therefore essential for climate-smart sanitation policy and for building a credible hub around EcoSan and the environment.
Where sanitation emissions come from across the full service chain
Sanitation emissions are generated at multiple stages, and accurate comparison starts with system boundaries. The main sources are embodied emissions from construction materials such as concrete, bricks, PVC, and steel; operational energy for flushing, pumping, aeration, dewatering, and disinfection; direct biological emissions from anaerobic decomposition and nitrification-denitrification; transport emissions from vacuum trucks and sludge hauling; and avoided or additional emissions associated with reuse products. In life cycle assessment terms, some studies report cradle-to-grave emissions, while others isolate operational emissions only. That difference alone can change rankings. A sewered system may look carbon intensive because of pipes and treatment energy, but a pit latrine can look much worse when methane from long-term anaerobic storage and uncontrolled emptying is included.
Methane is usually the dominant climate concern in onsite sanitation. Pits, septic tanks, and anaerobic lagoons create low-oxygen conditions that favor methanogenesis. Nitrous oxide becomes important where nitrogen is transformed through partial nitrification and denitrification, especially in wastewater treatment and soil application stages. Carbon dioxide from biogenic degradation is often treated differently in accounting, but fossil energy use is always material. Water use also matters indirectly. Conventional flush toilets typically use four to six liters per flush in efficient models and much more in older stock, creating larger wastewater volumes that require pumping and treatment. Dry and low-flush systems reduce that load. In every project I have reviewed, the fastest way to improve the carbon profile was to identify whether the major driver was methane from storage, electricity from treatment, or transport from fragmented sludge management.
Carbon footprint comparison of major sanitation systems
Different sanitation systems produce emissions through different mechanisms, so comparison must stay specific. Pit latrines often have low installation cost and no water demand, but unmanaged pits can have substantial methane emissions and create difficult emptying conditions. Septic tanks are widely used and familiar to households, yet they require regular desludging and can release methane continuously if effluent and sludge are not properly treated. Conventional sewered systems shift emissions away from the household and can improve hygiene and convenience, but they rely on extensive pipe networks, pumping stations, and treatment plants that consume energy. Composting toilets and urine-diverting dry toilets generally cut water use and can sharply reduce methane when liquids and solids are separated and the process remains aerobic. Container-based sanitation can also perform well when collection routes are efficient and treatment is centralized.
| System | Main emission sources | Typical strengths | Main carbon risks |
|---|---|---|---|
| Pit latrine | Methane from anaerobic storage, emptying transport | Low cost, no flushing water, simple construction | Uncontrolled decomposition, poor emptying access, leakage |
| Septic tank | Methane in tank, desludging fuel, downstream treatment | Common, scalable for dispersed housing | Infrequent desludging, weak effluent treatment, groundwater impacts |
| Sewer plus treatment plant | Electricity for pumping and aeration, nitrous oxide, embodied pipe materials | High service level, centralized control, potential energy recovery | Energy intensity, stormwater inflow, aging infrastructure |
| Composting toilet | Low direct emissions if aerobic, some material and maintenance impacts | Minimal water use, potential soil amendment output | Poor moisture control can cause odors and methane pockets |
| Urine-diverting dry toilet | Low direct emissions, transport and processing of separated streams | Nutrient recovery, low water demand, strong EcoSan fit | User acceptance, need for safe storage and reuse protocols |
| Container-based sanitation | Collection logistics, treatment energy, materials for containers | Works in dense informal areas, controlled waste chain | Route inefficiency and weak transfer operations increase emissions |
Real-world results confirm that management quality often matters more than the label of the system. I have seen urine-diverting toilets with excellent carbon performance because local operators kept urine separate, dried feces effectively, and linked outputs to agriculture. I have also seen nominally ecological systems fail because vaults were wet, maintenance was irregular, and reuse never happened. Likewise, well-run wastewater treatment plants with anaerobic digestion and biogas utilization can outperform poorly maintained onsite systems serving the same population. The decisive variables are oxygen conditions, moisture control, collection frequency, haul distance, treatment efficiency, and whether nutrient and energy recovery displace other high-emission products.
Why EcoSan can reduce emissions and where the limits appear
EcoSan can lower the carbon footprint of sanitation through three mechanisms: preventing methane formation, reducing water and energy demand, and recovering nutrients that substitute for industrial fertilizer. Urine diversion is especially important because urine contains most excreted nitrogen and much less organic carbon than feces. By separating it at the source, a urine-diverting dry toilet reduces the wet, anaerobic conditions that generate methane in mixed excreta systems. It also makes nutrient recovery more precise. Stored urine can be applied as fertilizer under controlled conditions, offsetting part of the emissions associated with synthetic nitrogen production, which is highly energy intensive through the Haber-Bosch process. Feces can then be dehydrated or composted with bulking material, ideally maintaining aerobic conditions that minimize methane production.
However, EcoSan is not automatically low carbon. Poorly ventilated vaults, excess moisture, or mixing with wash water can create anaerobic pockets. Long transport distances for small quantities can erase gains. If composting is incomplete or handled unsafely, public health risks rise and products may be rejected by farmers, eliminating the reuse benefit. Nitrous oxide can also occur if nitrogen-rich material is managed inconsistently. In practice, EcoSan works best when design, user training, and service models are aligned. Named tools such as life cycle assessment, material flow analysis, and fecal sludge flow diagrams help reveal whether a project is actually closing loops or simply relocating emissions. The strongest EcoSan projects I have evaluated paired toilet design with operator contracts, safe storage times, crop-specific reuse plans, and ongoing behavior support.
Context matters: urban density, climate, water scarcity, and infrastructure
No sanitation system has a fixed carbon score independent of place. Urban density changes everything. In dense neighborhoods, short collection routes and shared service points can make container-based or source-separated systems efficient, while retrofitting sewers may require massive embodied emissions and disruptive excavation. In dispersed rural settings, decentralized systems avoid pumping and long networks, but transport for desludging or product distribution can become the main emission source. Climate also matters. Warm temperatures speed biological activity and can increase methane generation in pits and lagoons. Arid regions place a premium on water-saving systems, making dry sanitation and urine diversion more attractive. High water tables or flood-prone zones complicate pits and septic systems because leakage, overflow, and contaminated emptying increase both health and climate risks.
Existing infrastructure strongly influences the best option. Where wastewater treatment plants already have anaerobic digesters, gas capture, and combined heat and power, optimizing the current sewered system may reduce emissions faster than replacing it. Where electricity grids are carbon intensive and aeration is inefficient, dry or minimally watered systems may offer a larger climate gain. Social acceptance and labor capacity must also be counted. A technically elegant EcoSan design will not sustain low emissions if users bypass urine diversion, if cleaning is difficult, or if there is no market for recovered products. The most reliable planning process combines greenhouse gas accounting with service level targets, affordability analysis, groundwater protection, and operation and maintenance realism.
How to measure and reduce the carbon footprint of sanitation systems
The most credible way to assess the carbon footprint of different sanitation systems is through life cycle assessment using clear functional units, such as emissions per person per year or per cubic meter treated, combined with direct estimates of methane and nitrous oxide. International standards such as ISO 14040 and ISO 14044 provide the basic framework for life cycle studies. For wastewater greenhouse gas estimation, practitioners also draw on IPCC methods and utility tools from organizations including the International Water Association. In project work, I start by mapping the service chain, quantifying flows, identifying anaerobic stages, then testing scenarios for collection frequency, energy source, and reuse substitution. That process usually reveals a small number of high-leverage interventions rather than a need to redesign everything.
Effective reduction measures are straightforward in principle. Keep organic material out of long anaerobic storage where possible. Separate urine and feces when source separation is feasible. Improve septic tank desludging frequency and ensure the sludge reaches controlled treatment. Capture and use biogas from digesters and larger treatment plants. Reduce infiltration and inflow in sewers to cut pumping and treatment loads. Install efficient blowers and process controls in activated sludge plants, since aeration often dominates electricity use. Use solar pumping where the duty cycle fits. For EcoSan systems, maintain dryness, provide bulking agents, verify pathogen reduction, and build reliable reuse pathways with farmers or landscapers. The climate benefit is greatest when sanitation is planned as a resource management system rather than a disposal problem.
The carbon footprint of different sanitation systems cannot be judged by toilet type alone; it depends on the full chain of containment, collection, treatment, transport, and reuse or disposal. That is the central lesson for anyone exploring EcoSan and the environment as a hub topic. Pit latrines and septic tanks may appear simple, yet unmanaged anaerobic conditions and weak sludge treatment can drive high methane emissions. Sewered systems can deliver strong service and pollution control, but energy use and infrastructure materials matter. EcoSan approaches, especially urine-diverting and well-managed dry systems, can reduce emissions by preventing methane, saving water, and recovering nutrients, but only when design and operations are disciplined.
The practical takeaway is to compare systems in context, using life cycle thinking and real service-chain data rather than assumptions. Decision-makers should ask four direct questions: where are methane and nitrous oxide formed, how much energy and transport does the system require, what materials are embedded in the infrastructure, and what recovery benefits realistically displace other emissions. When those questions are answered honestly, the best option becomes clearer. Use this hub as the starting point for deeper work on EcoSan and the environment, then evaluate your own sanitation context with measurable carbon, health, and operational criteria.
Frequently Asked Questions
1. What does the carbon footprint of a sanitation system actually include?
The carbon footprint of a sanitation system includes all greenhouse gas emissions associated with the full sanitation chain, not just what happens at the toilet itself. In practical terms, that means looking at emissions from the toilet interface, user practices, storage, emptying, transport, treatment, reuse, and final disposal. It also includes the energy and materials used to build, operate, maintain, and rehabilitate the system over time. For example, a flush toilet connected to a sewer may appear clean and efficient at the household level, but its total footprint can be influenced heavily by water pumping, sewer network construction, wastewater treatment energy demand, and sludge management.
A complete assessment usually considers carbon dioxide, methane, and nitrous oxide, all expressed as carbon dioxide equivalent. Methane is especially important in sanitation because it can form where waste decomposes without oxygen, such as in septic tanks, pit latrines, anaerobic lagoons, or poorly managed sludge storage. Nitrous oxide can also be significant, particularly where nitrogen-rich waste is treated biologically. In some systems, indirect emissions from electricity use or fuel for vacuum trucks are a larger share than direct biological emissions. In others, the opposite is true.
This is why comparing sanitation options requires a life-cycle perspective. The lowest-carbon option in one location may not be the lowest-carbon option elsewhere. Climate, population density, groundwater conditions, water availability, treatment performance, service reliability, and whether nutrients or energy are recovered all affect the result. A meaningful carbon footprint study asks not only how waste is contained, but also what happens next and how consistently the entire system functions in real life.
2. Which sanitation systems tend to have the highest and lowest carbon footprints?
There is no single ranking that applies everywhere, but some broad patterns are well established. Conventional sewered systems can have a relatively high carbon footprint when they require large volumes of water, energy-intensive pumping, long conveyance distances, and advanced treatment processes. Their footprint can increase further when wastewater treatment plants are poorly optimized or when sludge is transported long distances and disposed of without resource recovery. However, well-designed sewered systems powered by low-carbon electricity and equipped with energy recovery can perform much better than many people assume.
On-site systems such as pit latrines and septic tanks often have lower infrastructure and energy requirements than full sewer networks, which can reduce emissions from construction and operation. But they are not automatically low-carbon. If pits or tanks are unmanaged, frequently flood, leak, or store sludge under anaerobic conditions for long periods, methane emissions can be substantial. If fecal sludge is then dumped untreated or transported inefficiently, the footprint rises further. In many cities, the biggest problem is not the toilet technology itself but the lack of reliable emptying, transport, and treatment services.
EcoSan and other source-separating or resource-oriented systems can offer strong climate advantages when they reduce water use, avoid long-distance conveyance, and enable nutrient recovery or composting under well-controlled conditions. Urine-diverting dry toilets, composting toilets, container-based sanitation, and decentralized treatment systems can all have low footprints in the right setting, especially where they replace water- and energy-intensive infrastructure. That said, performance depends on management quality, user acceptance, pathogen control, and whether recovered products actually displace synthetic fertilizer, fuel, or other carbon-intensive inputs. In short, lower-carbon sanitation usually comes from systems that minimize methane formation, reduce energy demand, and recover useful resources safely and consistently.
3. Why is EcoSan often discussed in relation to climate and the environment?
EcoSan, or ecological sanitation, is frequently discussed in climate conversations because it reframes sanitation as a resource management system rather than a waste disposal problem. The central idea is to safely capture nutrients, organic matter, and sometimes water or energy from human excreta, while reducing pollution and dependence on centralized infrastructure. From a carbon perspective, this matters because conventional systems can be emissions-intensive through water use, pumping, treatment, sludge handling, and the loss of nutrients that must then be replaced with industrial fertilizers.
Many EcoSan approaches aim to interrupt these emissions pathways. For example, urine diversion can separate a nutrient-rich stream that may be treated and reused more efficiently than mixed wastewater. Dry or low-water systems can reduce the energy burden associated with water supply and sewer transport. Well-managed composting or dehydration systems may also reduce methane generation compared with unmanaged anaerobic storage. If the outputs are safely reused in agriculture or landscaping, they may offset emissions from fertilizer production, soil amendments, or even energy inputs, depending on the design.
Still, EcoSan is not automatically climate-positive. Its benefits depend on careful operation, regular maintenance, strong user engagement, and safe reuse practices. If a system is poorly maintained, abandoned, or culturally mismatched, theoretical environmental gains may not materialize. In schools, emergency settings, rural settlements, and housing projects, long-term success often depends on whether collection, treatment, training, and institutional responsibilities are clearly defined. EcoSan can be a powerful strategy for lowering the carbon footprint of sanitation, but only when the full service chain is designed to work in the local context.
4. How do methane and nitrous oxide emissions differ across sanitation systems?
Methane and nitrous oxide are the two non-carbon-dioxide greenhouse gases most often associated with sanitation, and they behave very differently depending on the treatment conditions. Methane forms mainly when organic matter decomposes without oxygen. That means it is commonly associated with pit latrines, septic tanks, anaerobic digesters, lagoons, sludge holding tanks, and sediments in poorly managed wastewater systems. The longer waste remains in warm, oxygen-poor conditions, the greater the potential for methane generation. This is one reason why containment and storage conditions matter so much in carbon footprint calculations.
Nitrous oxide is linked more closely to nitrogen transformation, especially in systems where ammonia is converted through biological treatment. It can be emitted in wastewater treatment plants, sludge treatment processes, and land application settings where nitrogen is present and environmental conditions fluctuate between aerobic and low-oxygen states. While nitrous oxide is usually emitted in smaller quantities than methane, it has a very high global warming impact per unit mass, so even small releases can be important. Systems that intensively treat nitrogen may reduce water pollution but still need careful process control to limit climate impacts.
The key takeaway is that sanitation design involves trade-offs. A system that minimizes methane through more aerobic treatment may still generate nitrous oxide if nitrogen removal is poorly controlled. A highly anaerobic system may produce methane but could also create opportunities for energy recovery if biogas is captured and used. This is why the best climate outcome is rarely achieved by focusing on a single component. Good carbon performance comes from integrated design: limiting uncontrolled anaerobic emissions, optimizing nitrogen treatment, improving sludge management, and ensuring the system actually operates as intended over time.
5. How can cities, rural communities, schools, and emergency programs choose lower-carbon sanitation options?
The most effective way to choose a lower-carbon sanitation option is to evaluate the whole service chain and local operating conditions rather than selecting a technology based on appearance or convention. In dense urban areas, decision-makers should look at water demand, pumping needs, sewer leakage, treatment energy use, sludge logistics, and whether existing facilities can recover energy or nutrients. In rural communities, lower-water or decentralized systems may be more practical, but planners still need to assess emptying frequency, seasonal flooding, groundwater protection, and realistic maintenance capacity. Schools need systems that are not only low-emission but also durable, easy to clean, gender-responsive, and manageable by staff with limited technical support.
In emergency and displacement settings, the priorities are speed, safety, and service continuity, but carbon considerations still matter. Temporary facilities that rely on frequent trucked removal over long distances may carry a high emissions burden, especially if treatment is unavailable. Container-based systems, modular decentralized treatment, or carefully planned shared facilities can sometimes reduce both emissions and operational risk. The right choice depends on how long the system will be used, whether local treatment exists, and how safely waste can be collected and processed.
Across all contexts, lower-carbon sanitation decisions usually come from a few consistent principles: reduce unnecessary water use, prevent uncontrolled methane generation, shorten transport distances, improve treatment efficiency, and create safe reuse pathways where appropriate. It also helps to consider the electricity mix, construction materials, expected lifespan, and institutional reliability. A system with slightly higher upfront emissions may still have a lower lifetime footprint if it is well managed and prevents chronic failures. Ultimately, the best sanitation option is one that protects public health, works operationally, fits user needs, and keeps emissions low across the entire chain from toilet to final reuse or disposal.